
vue-chrts-overview
This is a Vue 3 chart package inspired by Tremor, built on top of Unovis.
التثبيت
CLI
npx skills add https://github.com/dennisadriaans/vue-chrts --skill vue-chrts-overviewقم بتثبيت هذه المهارة باستخدام واجهة سطر الأوامر (CLI) وابدأ في استخدام سير عمل SKILL.md في مساحة عملك.
آخر تحديث 4/29/2026
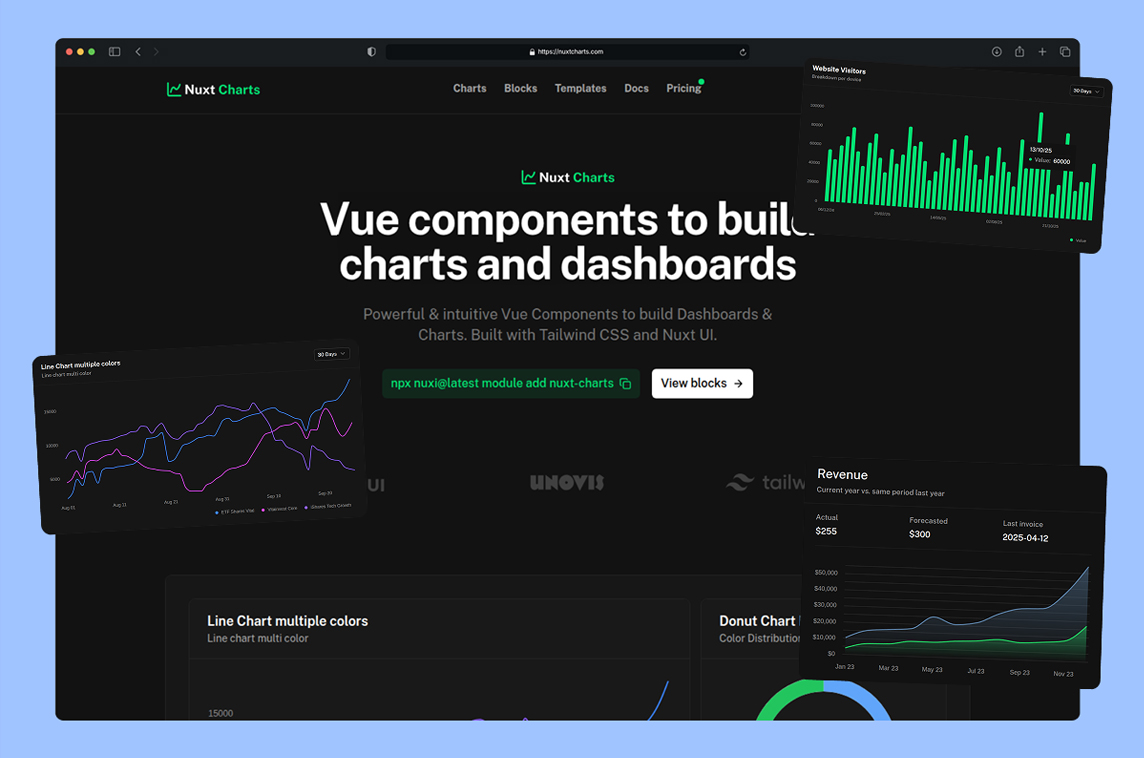
Vue-chrts
This is a monorepo for vue-chrts & nuxt-charts
A Vue 3 charts package inspired by Tremor, built on top of Unovis. Vue-Chrts provides beautiful, responsive charts for your Vue applications with minimal setup.
Features
- 📊 Multiple chart types: Line, Bar, Area, Stacked Area, Donut
- 🎨 Customizable
- 📱 Responsive design
- 💡 Simple, intuitive API
- 🚀 Built with Vue 3 and TypeScript
Installation Nuxt
# npm
npm install nuxt-charts

# yarn
yarn add nuxt-charts

# pnpm
pnpm add nuxt-charts

# Add module to your nuxt.config.ts
export default defineNuxtConfig({
  modules: ["nuxt-charts"]
});
Installation Vue.js
# npm
npm install vue-chrts

# yarn
yarn add vue-chrts

# pnpm
pnpm add vue-chrts

# import component
import { LineChart } from 'vue-chrts';
Usage Example
<script setup>
import { LineChart } from 'vue-chrts';

const data = [
  { month: 'Jan', sales: 100, profit: 50 },
  { month: 'Feb', sales: 120, profit: 55 },
  { month: 'Mar', sales: 180, profit: 80 },
  { month: 'Apr', sales: 110, profit: 40 },
  { month: 'May', sales: 90, profit: 30 },
];

const categories = {
  sales: {
    name: 'Sales',
    color: '#3b82f6'
  },
  profit: {
    name: 'Profit',
    color: '#10b981'
  }
};

const xFormatter = (i) => data[i].month;
</script>

<template>
  <LineChart
    :data="data"
    :categories="categories"
    :height="300"
    :xFormatter="xFormatter"
    xLabel="Month"
    yLabel="Amount"
  />
</template>
Available Charts
LineChartBarChartAreaChartAreaStackedChartDonutChart
Vue charts
Make better dashboards with with Vue charts This library simplifies the process of integrating beautiful Vue charts into any modern web application or dashboard.
Credits
This library is inspired by Tremor and built on top of Unovis.
Angular
Looking for the Angular charts variant? Check the Angular Charts website or the GitHub repo here.
License
MIT